1 November 2017
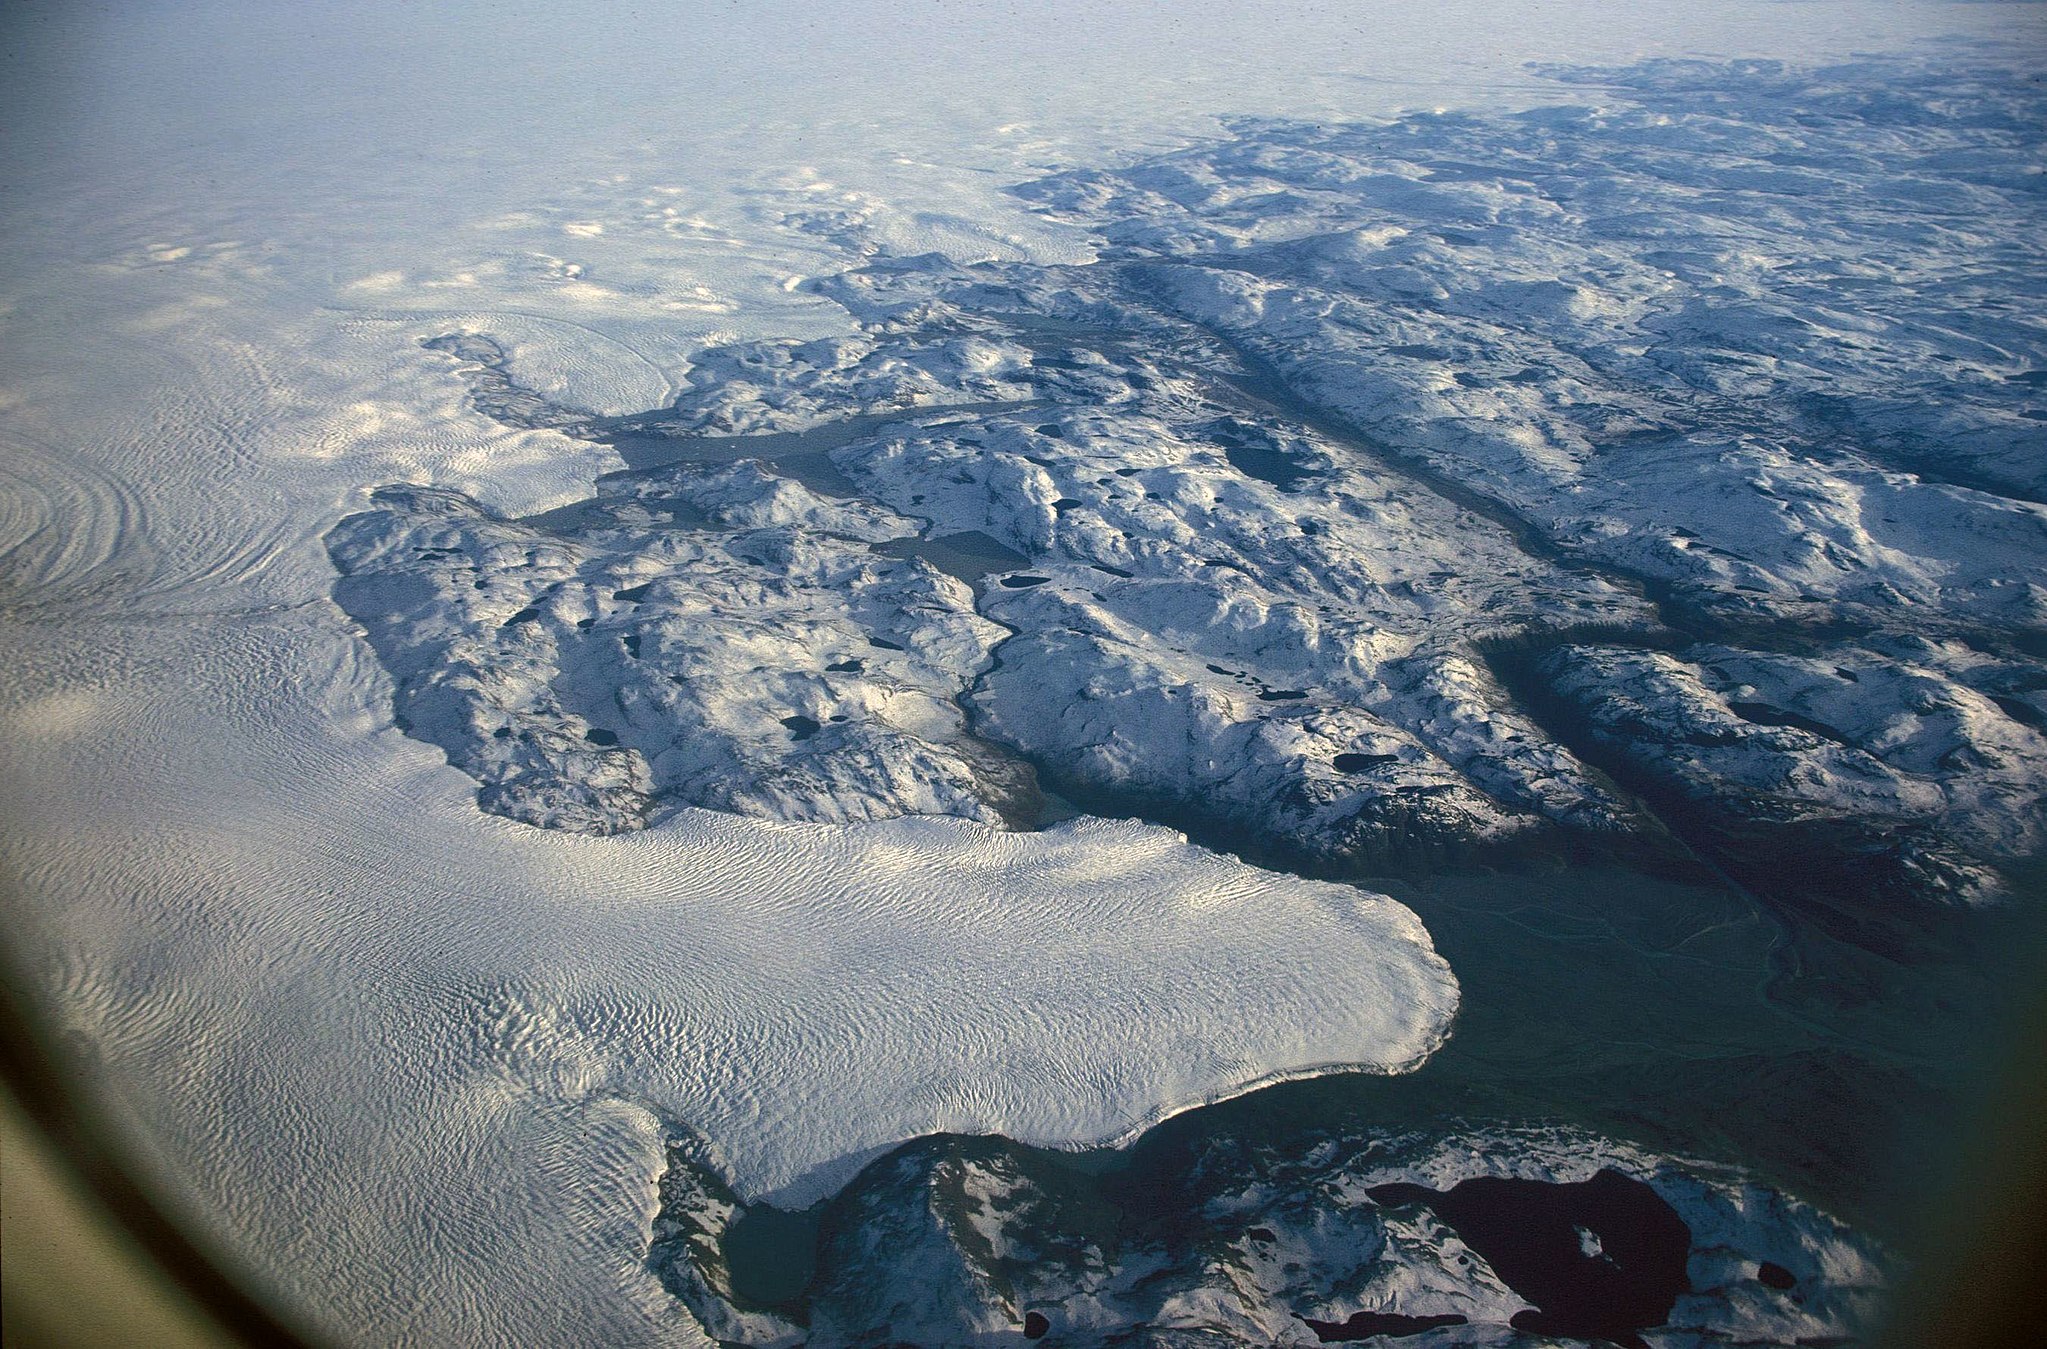
An aerial view of the Greenland ice sheet taken in September 1992. New research finds two to four times as many of Greenland’s coastal glaciers are at risk of accelerated melting due to climate change as previously thought.
Credit: Hannes Grobe, Alfred Wegener Institute for Polar and Marine Research (Own work), CC BY-SA 2.5
WASHINGTON D.C. — New maps of Greenland’s coastal seafloor and bedrock beneath its massive ice sheet show that two to four times as many coastal glaciers are at risk of accelerated melting due to climate change as previously thought.
In a new study, researchers at the University of California at Irvine (UCI), NASA and 30 other institutions have published the most comprehensive, accurate and high-resolution relief maps ever made of Greenland’s bedrock and coastal seafloor. The new study was published today in Geophysical Research Letters, a journal of the American Geophysical Union.
The top 200 meters (600 feet) of ocean water around Greenland comes from the Arctic and is relatively cold. But the water below 200 meters comes from farther south and is 3 to 4 degrees Celsius (6 to 8 degrees Fahrenheit) warmer than the water above. The new maps reveal that two to four times more oceanfront glaciers extend deeper than 200 meters below sea level than earlier maps showed. This means more deeper-seated glaciers are exposed to this warmer water, which melts them more rapidly.
The research team used the new maps to refine their estimate of Greenland’s total volume of ice and its potential to add to global sea level rise, if the ice were to melt completely, which is not expected to occur within the next few hundred years. Their results suggest Greenland’s contribution to future sea level rise is 7.42 meters (24.34 feet), 7 centimeters (2.76 inches) higher than previous estimates.
“These results suggest that Greenland’s ice is more threatened by changing climate than we had anticipated,” said Josh Willis, OMG principal investigator and researcher at NASA’s Jet Propulsion Laboratory in Pasadena, California, who was not involved in producing the new maps.
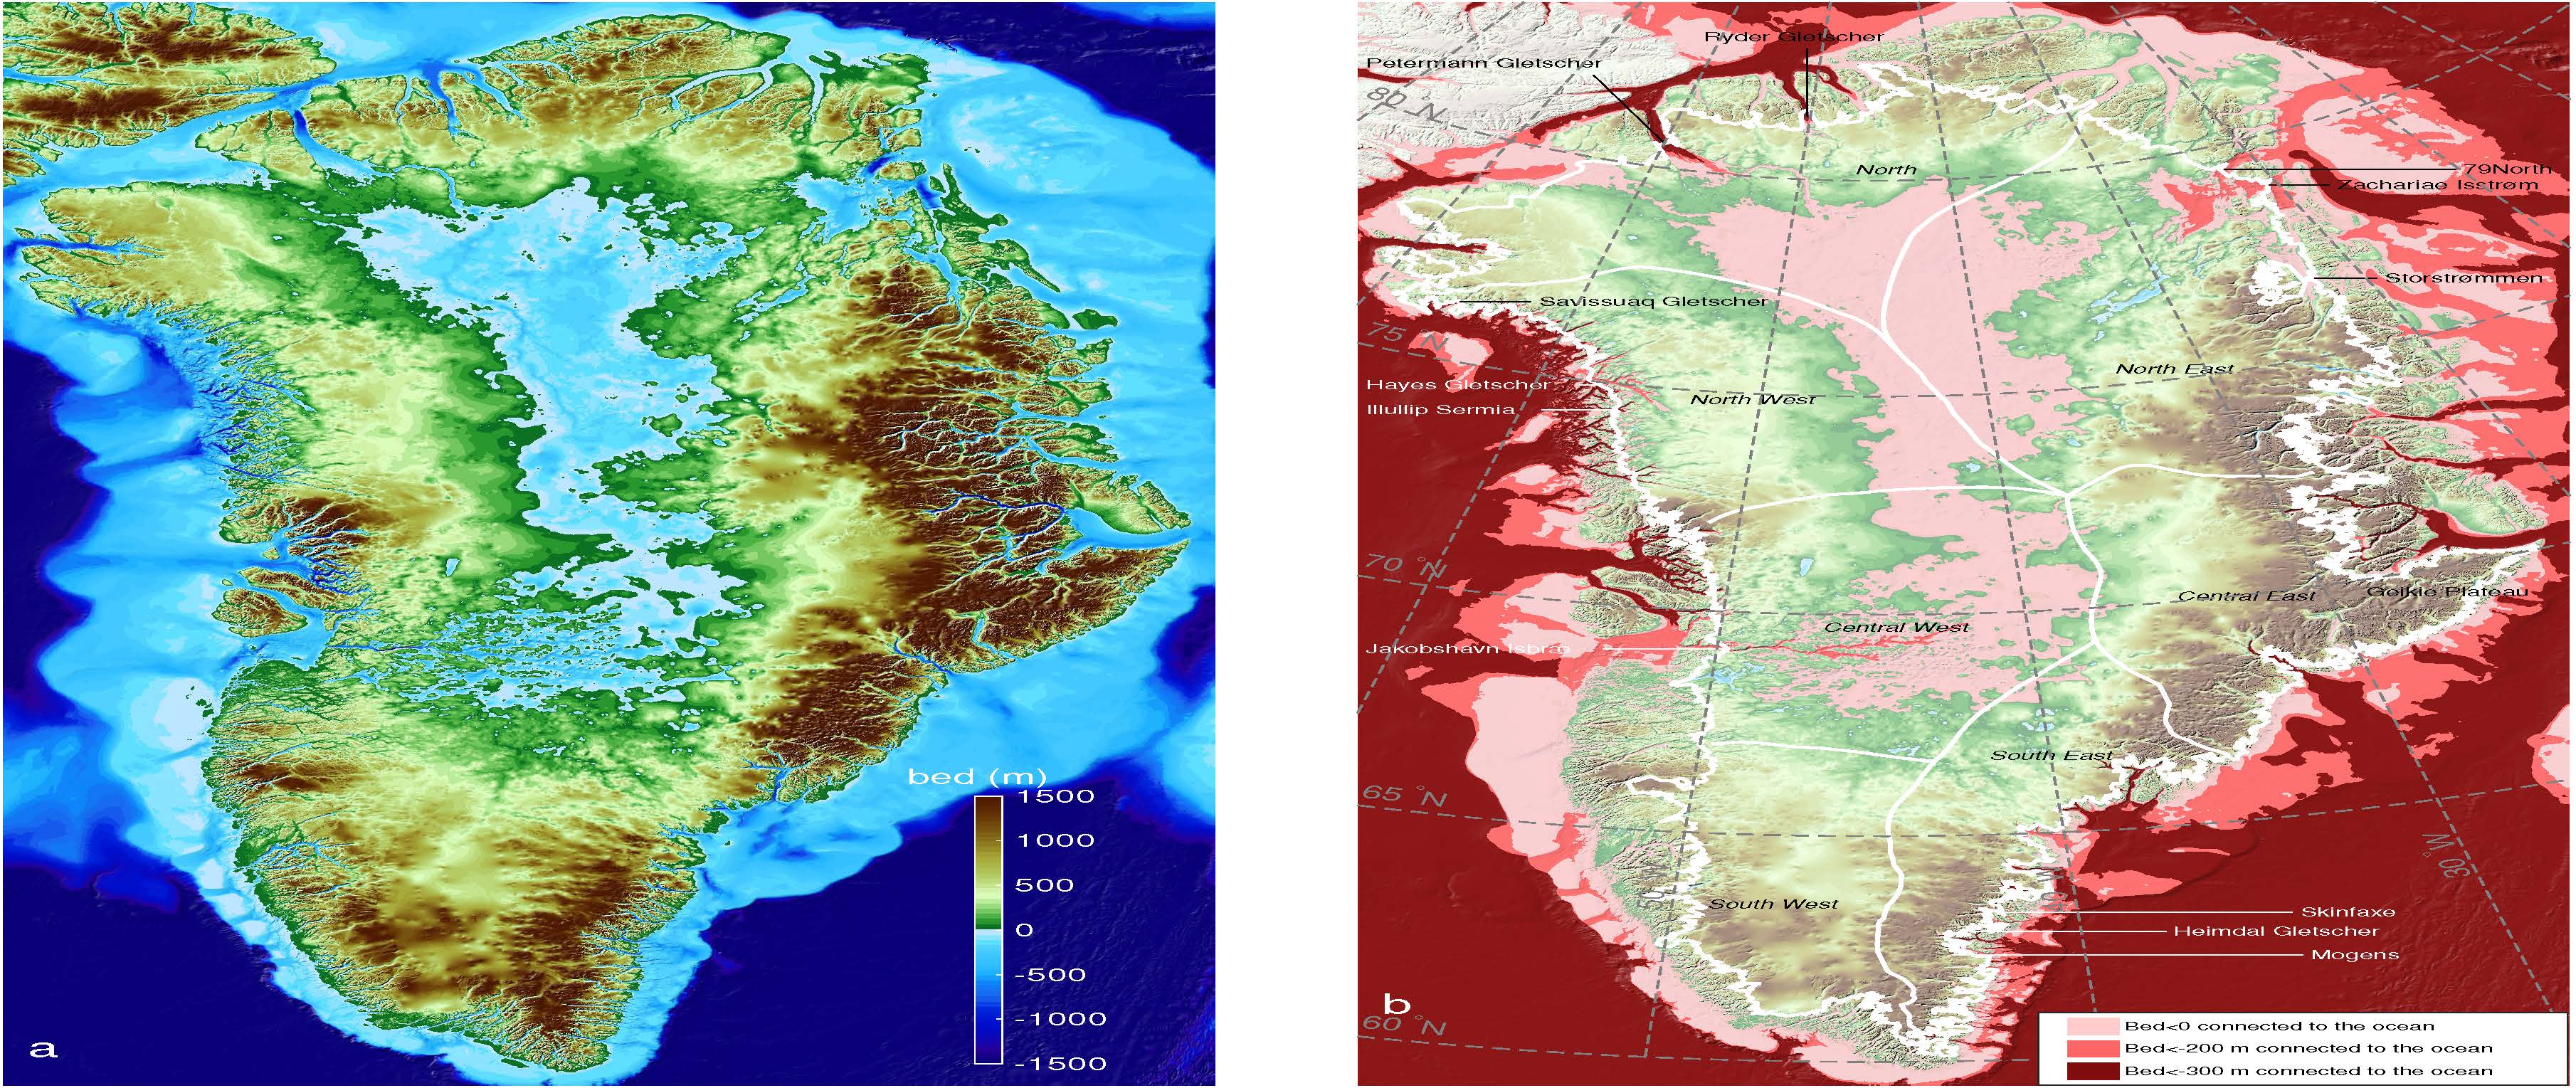
New maps of Greenland’s coastal seafloor and bedrock beneath its massive ice sheet taken by an ice sheet mapper called BedMachine. The map on the left shows Greenland’s topography from 1,500 meters (5,000 feet) below sea level to 1,500 meters above sea level. The map on the right shows regions below sea level (light pink) that are connected to the ocean and maintain a depth below 200 meters (600 feet) (dark pink), and that are continuously deeper than 300 m below sea level (dark red). The thin white line shows the current ice sheet extent.
Credit: AGU/GRL/UC Irvine.
Among the many data sources incorporated into the new maps is data from NASA’s Ocean Melting Greenland (OMG) campaign. Mathieu Morlighem, an Earth systems scientist at UCI in Irvine, California and lead author of the new study, had demonstrated in an earlier paper that data from OMG’s survey of the shape and depth, or bathymetry, of the seafloor in Greenland’s fjords improved scientists’ understanding not only of the coastline, but of the bedrock inland beneath glaciers that flow into the ocean. That’s because the bathymetry at a glacier’s front limits the possibilities for the shape of bedrock farther upstream.
The nearer to the shoreline, the more valuable the bathymetry data are for understanding on-shore topography, Morlighem said. “What made OMG unique compared to other campaigns is that they got right into the fjords, as close as possible to the glacier fronts,” he said. “That’s a big help for bedrock mapping.” Additionally, the OMG campaign surveyed large sections of the Greenland coast for the first time ever. In fjords for which there are no data, it’s difficult to estimate how deep the glaciers extend below sea level.
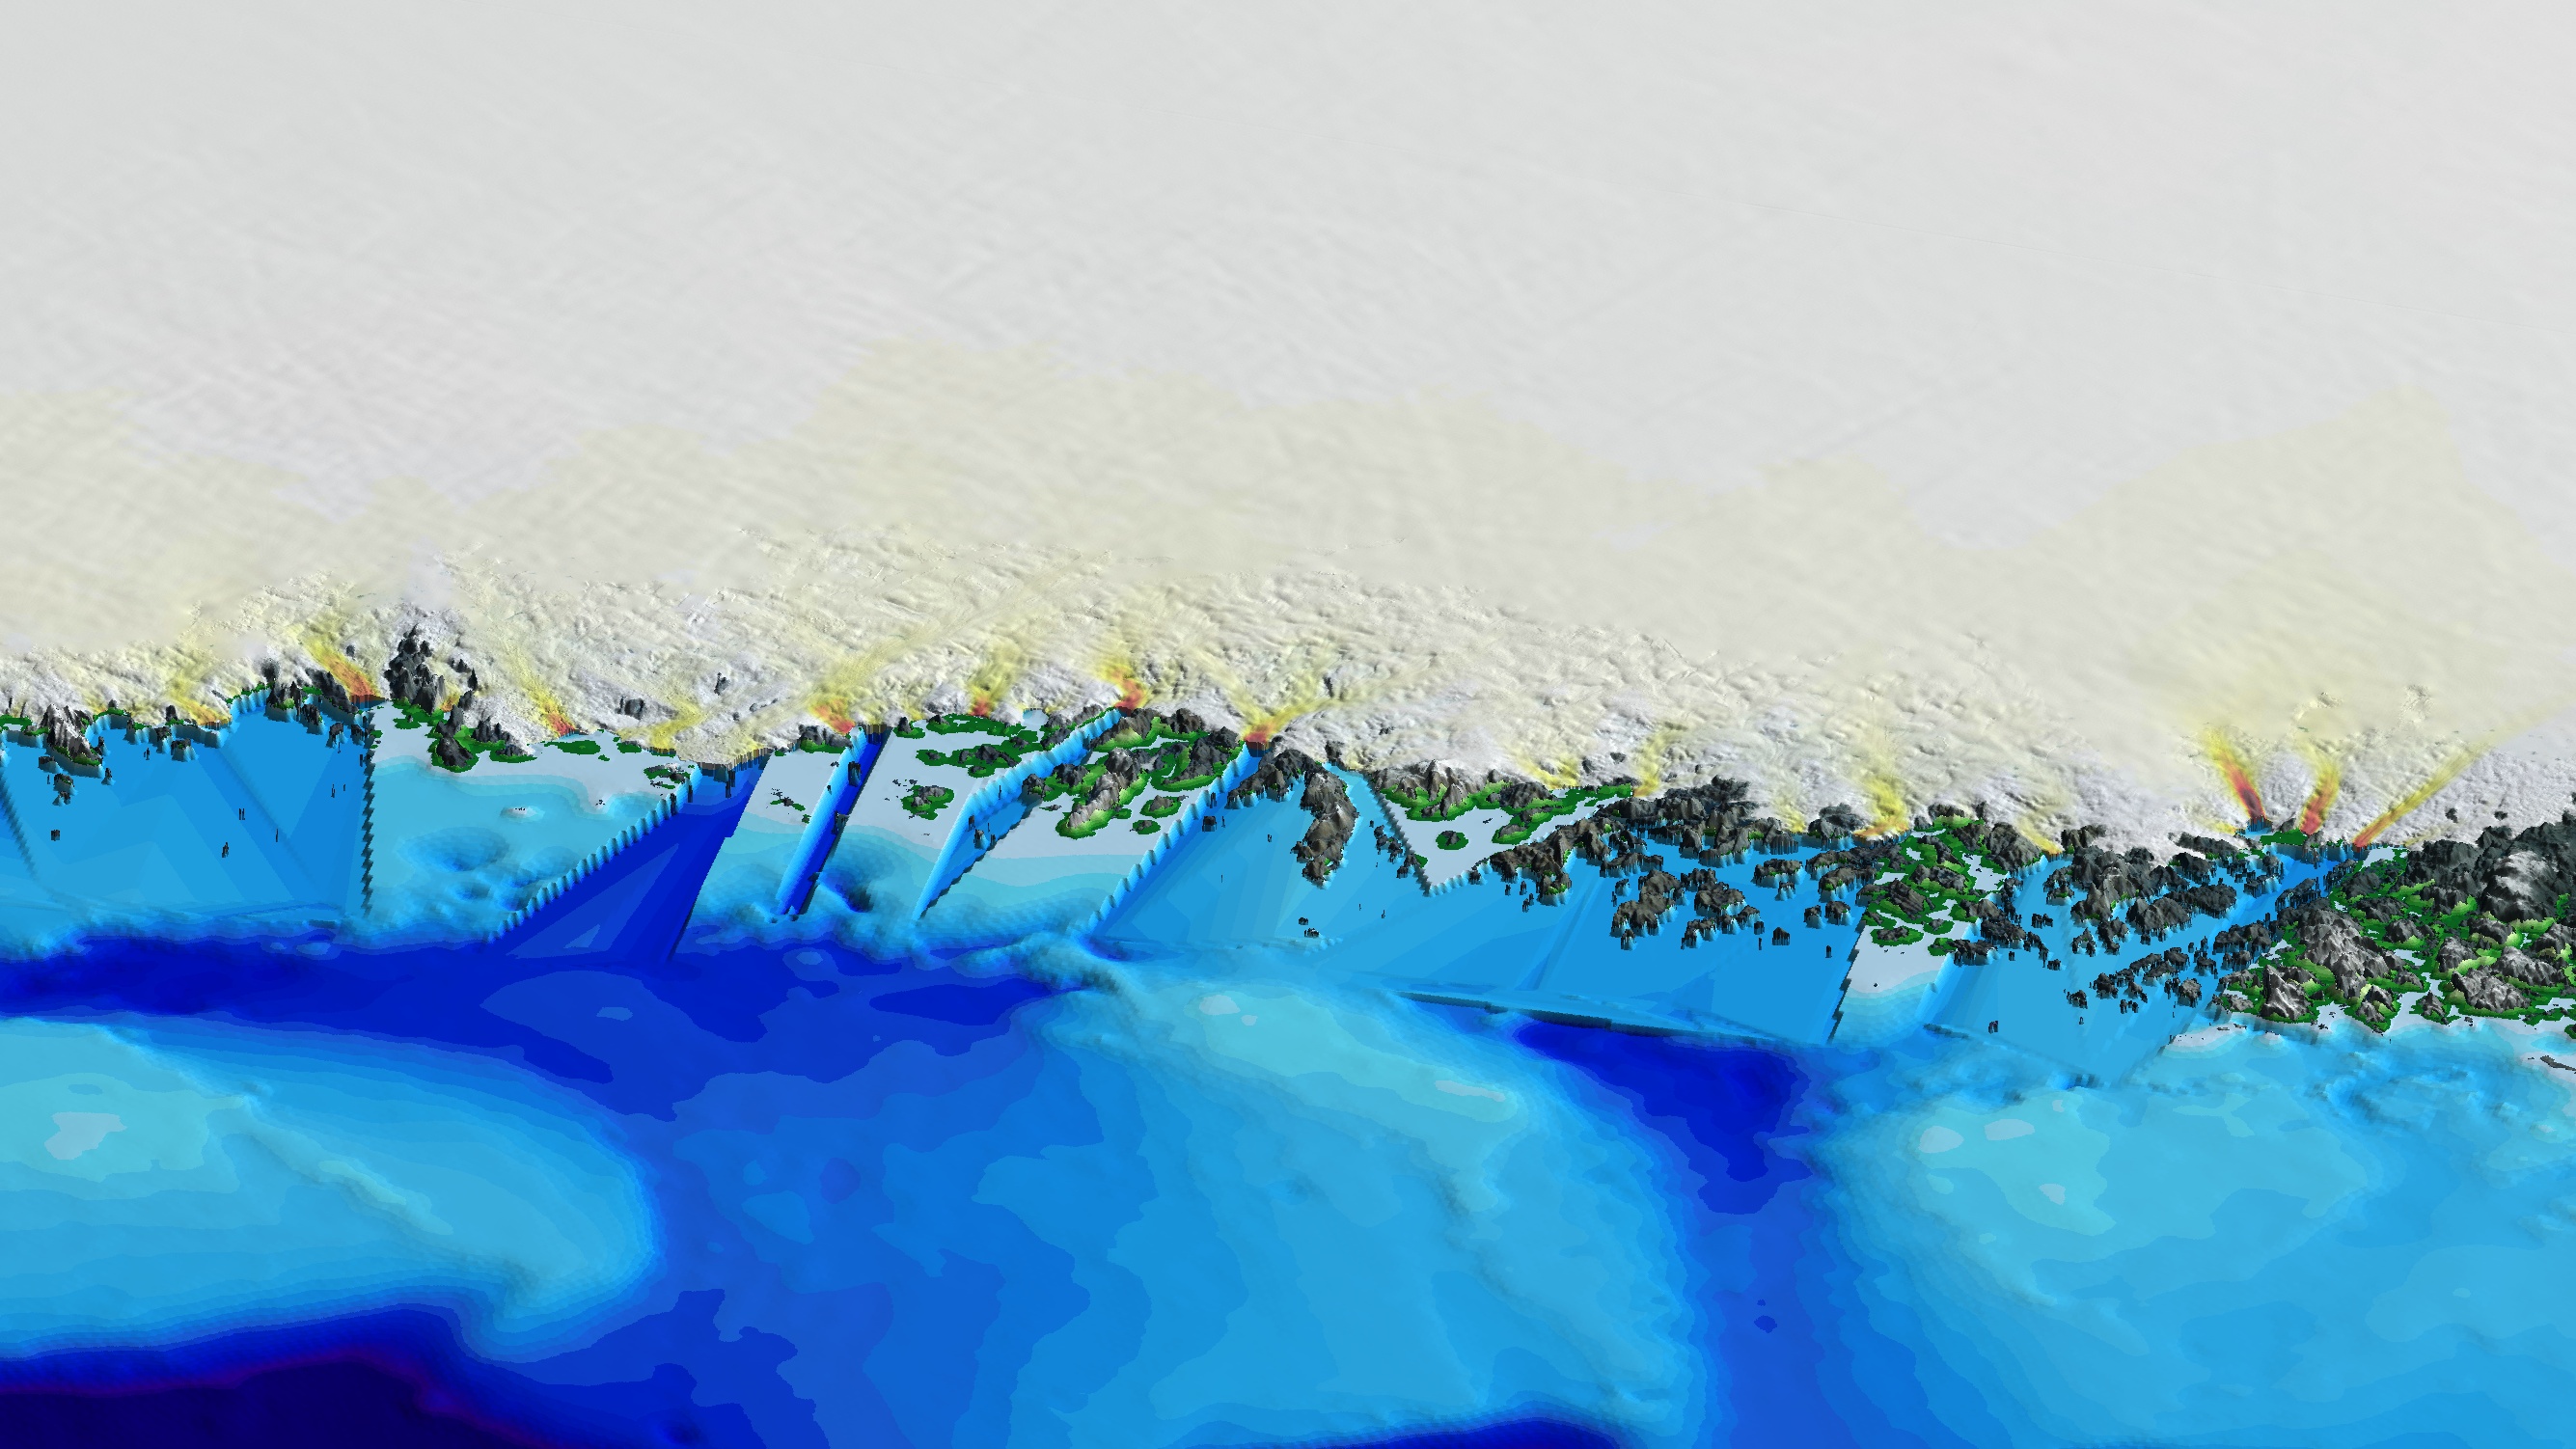

A stretch of Greenland’s coastline as created by BedMachine before (top) and after (bottom) the inclusion of new OMG data. Credit: UC Irvine.
The OMG data are only one of many datasets Morlighem and his team used in the ice sheet mapper, called BedMachine. Another comprehensive source is NASA’s Operation IceBridge airborne surveys. IceBridge measures the ice sheet thickness directly along a plane’s flight path. This creates a set of long, narrow strips of data rather than a complete map of the ice sheet. Besides NASA, almost 40 other international collaborators also contributed various types of survey data on different parts of Greenland.
No survey, not even OMG, covers every glacier on Greenland’s long, convoluted coastline. To infer the bed topography in sparsely studied areas, BedMachine averages between existing data points using physical principles such as the conservation of mass.
On October 23, the five-year OMG campaign completed its second annual set of airborne surveys to measure, for the first time, the amount that warm water around the island is contributing to the loss of the Greenland ice sheet. Besides the one-time bathymetry survey, OMG is collecting annual measurements of the changing height of the ice sheet and the ocean temperature and salinity in more than 200 fjord locations. Morlighem looks forward to improving BedMachine’s maps with data from the airborne surveys.
###
The American Geophysical Union is dedicated to advancing the Earth and space sciences for the benefit of humanity through its scholarly publications, conferences, and outreach programs. AGU is a not-for-profit, professional, scientific organization representing 60,000 members in 137 countries. Join the conversation on Facebook, Twitter, YouTube, and our other social media channels.
Notes for Journalists
This research article is open access. A PDF copy of the article can be downloaded at the following link: http://onlinelibrary.wiley.com/doi/10.1002/2017GL074954/pdf.
Journalists and PIOs may also order a copy of the final paper by emailing a request to Lauren Lipuma at [email protected]. Please provide your name, the name of your publication, and your phone number.
Neither the paper nor this press release is under embargo.
“BedMachine v3: Complete bed topography and ocean bathymetry mapping of Greenland from multi-beam echo sounding combined with mass conservation”
Authors:
M. Morlighem, L. An, R. Millan, M. Wood, J. Mouginot: University of California, Irvine, Department of Earth System Science, Irvine, California, U.S.A.;
C. N. Williams: Bristol Glaciology Centre, School of Geographical Sciences, University of Bristol, Bristol, United Kingdom; Now at British Geological Survey, Nicker Hill, Keyworth, Nottingham, United Kingdom;
E. Rignot: University of California, Irvine, Department of Earth System Science, Irvine, California, U.S.A.; Jet Propulsion Laboratory – California Institute of technology, Pasadena, California, U.S.A.;
J. E. Arndt, B. Dorschel, P. Slabon, W. Weinrebe: Alfred-Wegener-Institute, Helmholtz Centre for Polar and Marine Research, Bremerhaven, Germany;
J. L. Bamber, T. M. Jordan: Bristol Glaciology Centre, School of Geographical Sciences, University of Bristol, Bristol, United Kingdom;
G. Catania: Institute of Geophysics, University of Texas, Austin, Texas, U.S.A.;
N. Chauché: Department of Geography and Earth Science, Aberystwyth University, Aberystwyth, United Kingdom;
J. A. Dowdeswell: Scott Polar Research Institute, University of Cambridge, Cambridge, United Kingdom;
I. Fenty, H. Seroussi: Jet Propulsion Laboratory – California Institute of technology, Pasadena, California, U.S.A.;
K. Hogan: British Antarctic Survey, Natural Environment Research Council, High Cross, Cambridge, United Kingdom;
I. Howat: Byrd Polar and Climate Research Center, Ohio State University, Columbus, Ohio, U.S.A.;
A. Hubbard: Department of Geography and Earth Science, Aberystwyth University, Aberystwyth, United Kingdom; Centre for Arctic Gas Hydrate, Environment and Climate, Department of Geosciences, UiT The Arctic University of Norway, Tromsø, Norway;
M. Jakobsson: Department of Geology and Geochemistry, Stockholm University, Stockholm, Sweden;
K. K. Kjeldsen: Centre for GeoGenetics, Natural History Museum of Denmark, University of Copenhagen, Copenhagen, Denmark; Department of Earth Sciences, University of Ottawa, Ottawa, Canada; Department of Geodesy, DTU Space, National Space Institute, Technical University of Denmark, Kongens Lyngby, Denmark;
L. Mayer: Center for Coastal and Ocean Mapping, University of New Hampshire, Durham, New Hampshire, U.S.A.;
B. P. Y. Noël, M. R. van den Broeke: Institute for Marine and Atmospheric research Utrecht (IMAU), Utrecht University, the Netherlands;
C. O’Cofaigh: Department of Geography, Durham University, Science Laboratories, South Road, Durham, United Kingdom;
S. Palmer: College of Life and Environmental Sciences, University of Exeter, Exeter, United Kingdom;
S. Rysgaard: Centre for Earth Observation Science, Department of Environment and Geography, University of Manitoba, Winnipeg, Canada; Greenland Institute of Natural Resources, Nuuk, Greenland; Arctic Research Centre, Aarhus University, Aarhus, Denmark;
M. J. Siegert: Grantham Institute and Department of Earth Science and Engineering, Imperial College, London, United Kingdom;
F. Straneo: Department of Physical Oceanography, Woods Hole Oceanographic Institution, Woods Hole, Massachusetts, U.S.A.
K. B. Zinglersen: Greenland Institute of Natural Resources, Nuuk, Greenland;
Contact information for the authors:
Mathieu Morlighem: [email protected], +1 (949) 824-1353.
Lauren Lipuma
+1 (202) 777-7396
[email protected]
NASA Jet Propulsion Laboratory Press Contact:
Alan Buis
+1 (818) 354-0474
[email protected]
University of California Irvine Press Contact:
Brian Bell
+1 (949) 824-8249
[email protected]