Project utilized 25 years of data from six international satellite missions
29 July 2019
WASHINGTON — Constructed from a quarter century’s worth of satellite data, a new map of Antarctic ice velocity by glaciologists from the University of California, Irvine and NASA’s Jet Propulsion Laboratory is the most precise ever created.
Published today in a new paper in the AGU journal Geophysical Research Letters, the map is 10 times more accurate than previous renditions, covering more than 80 percent of the continent.
“By utilizing the full potential of interferometric phase signals from satellite synthetic-aperture radars, we have achieved a quantum leap in the description of ice flow in Antarctica,” said lead author Jeremie Mouginot, UCI associate researcher in Earth system science. “This more detailed representation will help improve our understanding of ice behavior under climate stress over a larger part of the continent, farther south, and will enable improved projections of sea level rise through numerical models.”
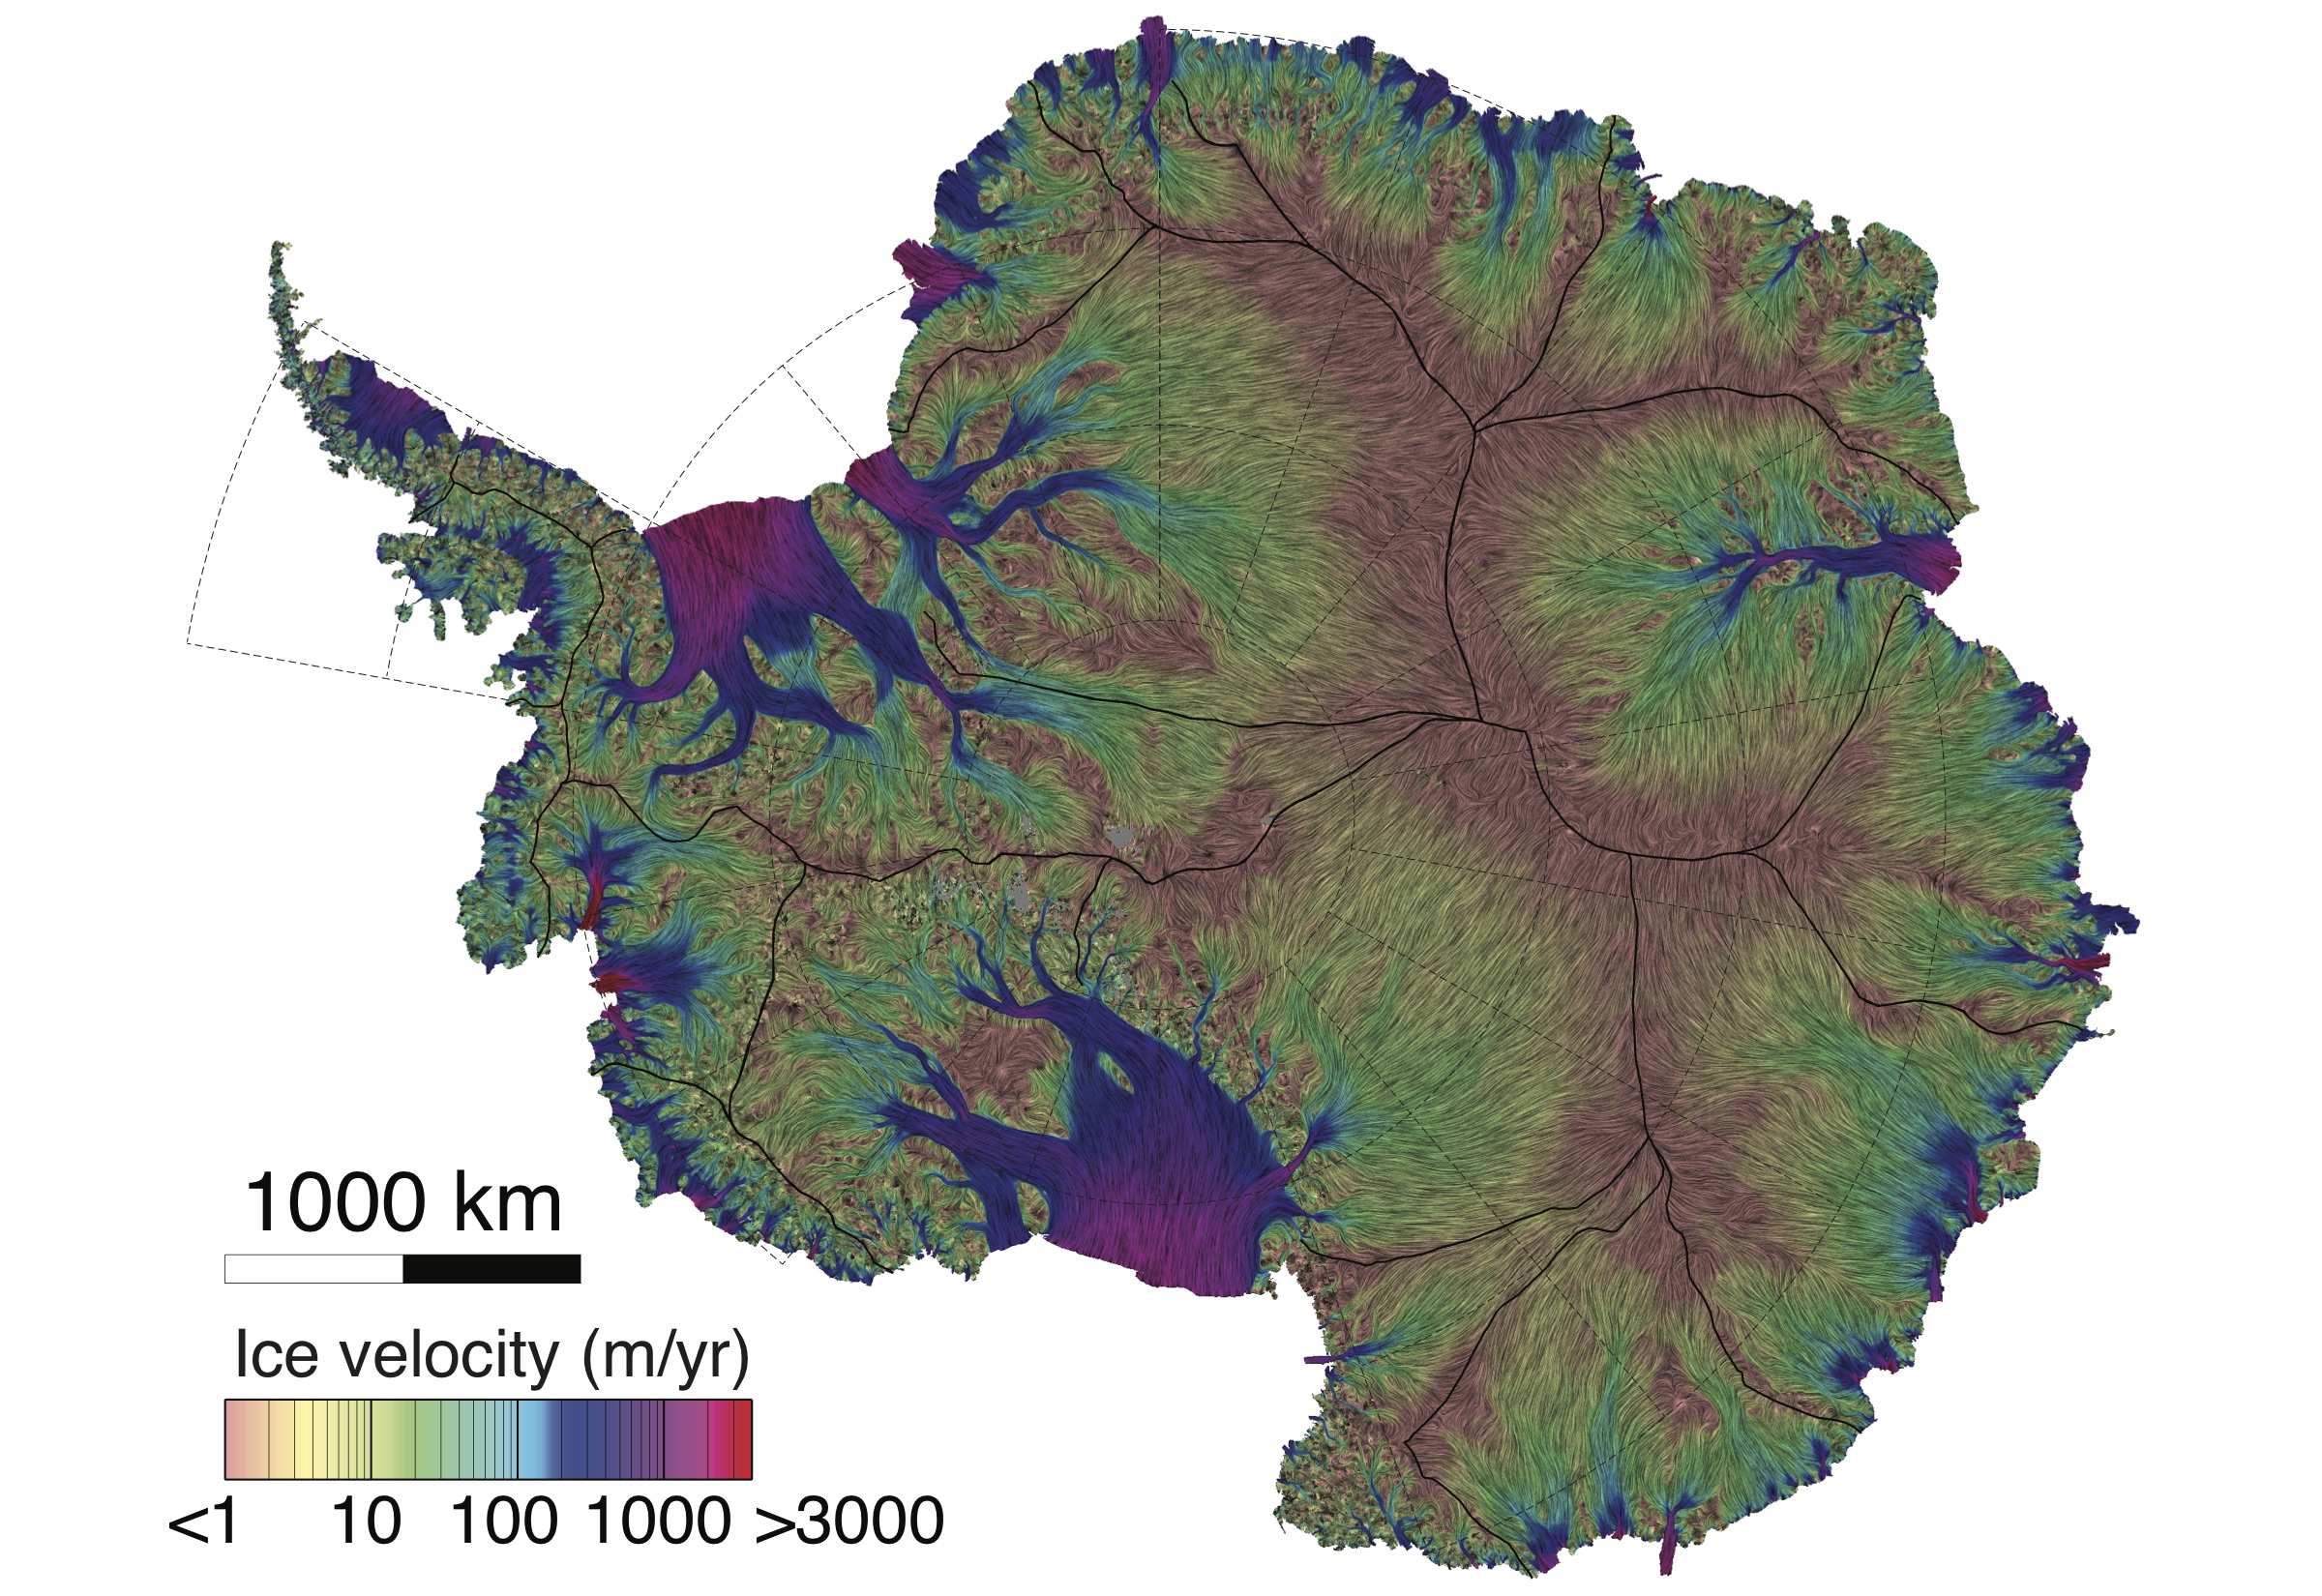
A new map of Antarctic ice velocity constructed from nearly a quarter century’s worth of satellite data.
Credit: AGU
To chart the movement of ice sheets across the surface of the enormous land mass, the researchers combined input from six satellite missions: the Canadian Space Agency’s Radarsat-1 and Radarsat-2; the European Space Agency’s Earth remote sensing satellites 1 and 2 and Envisat ASAR; and the Japan Aerospace Exploration Agency’s ALOS PALSAR-1.
While the data were spread across 25 years, the pace of signal gathering accelerated in the last decade as more resources were deployed in the Earth’s orbit. As ice sheet science coordinator in the World Meteorological Organization’s Polar Space Task Group, co-author Bernd Scheuchl, UCI associate project scientist in Earth system science, was responsible for acquiring the relevant data from the various international space agencies.
Previous mapping efforts relied heavily on “feature” and “speckle tracking” methods, which detect the subtle motion of parcels of ice on the ground over time; this approach has been proven effective in estimating ice flow speed. To measure significantly slower ice sheet movement in the vast interior regions, the UCI team augmented these techniques with synthetic-aperture radar phase interferometry, which detects the subtle motion of natural reflectors of radar signals in snow/ice independent of the size of the parcel of ice illuminated by the radar.
“The interferometric phase of SAR data measures the ice deformation signal with a precision of up to two orders of magnitude better than speckle tracking,” Mouginot said. “A drawback is that it requires a lot more data, namely multiple passes at different angles over the same point on the ground – a problem that was solved by a consortium of international space agencies pointing Earth-monitoring spacecrafts to this part of the world.”
The team was able to compose a map that resolves ice movement to a level of 20 centimeters (a little over half a foot) per year in speed and 5 degrees in annual flow direction for more than 70 percent of Antarctica. It’s the first time that high-precision mapping of the interior areas has been accomplished.
“This product will help climate scientists achieve a number of goals, such as a better determination of the boundaries between glaciers and a thorough evaluation of regional atmospheric climate models over the entire continent,” said co-author Eric Rignot, chair and Donald Bren Professor of Earth System Science at UCI and a JPL senior research scientist.
“It will also help in locating the most promising sites for ice core drilling to extract climate records and in examining the mass balance of Antarctica beyond its periphery.”
He said he’s looking forward to the joint NASA and Indian Space Research Organization satellite, launching in late 2021, which will be the first interferometric-mode SAR mission designed to look solely toward the South Pole. The spacecraft will provide a coast-to-coast view of Antarctica every 12 days.
“We’ll be able to collect enough quality phase data over the Antarctic to generate updates to the map we just created in one or two months instead of one or two decades,” Rignot said. “With this level of precision in the interior regions, we’ll be able to reconstruct high-resolution spatial details in the bed topography beneath the ice through inversion techniques over far broader areas than in previous attempts – essential to improving ice sheet models and projections of sea level rise from Antarctica.”
The new Antarctic ice velocity map and related datasets are available for download at the NASA Distributed Active Archive Center at the National Snow & Ice Data Center. This project was supported by NASA’s MEaSUREs program.
###
Founded in 1919, AGU is a not-for-profit scientific society dedicated to advancing Earth and space science for the benefit of humanity. We support 60,000 members, who reside in 135 countries, as well as our broader community, through high-quality scholarly publications, dynamic meetings, our dedication to science policy and science communications, and our commitment to building a diverse and inclusive workforce, as well as many other innovative programs. AGU is home to the award-winning news publication Eos, the Thriving Earth Exchange, where scientists and community leaders work together to tackle local issues, and a headquarters building that represents Washington, D.C.’s first net zero energy commercial renovation. We are celebrating our Centennial in 2019. #AGU100
Founded in 1965, UCI is the youngest member of the prestigious Association of American Universities. The campus has produced three Nobel laureates and is known for its academic achievement, premier research, innovation and anteater mascot. Led by Chancellor Howard Gillman, UCI has more than 36,000 students and offers 222 degree programs. It’s located in one of the world’s safest and most economically vibrant communities and is Orange County’s second-largest employer, contributing $5 billion annually to the local economy. For more on UCI, visit www.uci.edu.
Notes for Journalists
This paper is freely available for 30 days. Journalists and public information officers (PIOs) can download a PDF copy of the article by clicking on this link: https://agupubs.onlinelibrary.wiley.com/doi/abs/10.1029/2019GL083826
Journalists and PIOs may also request a copy of the final paper by emailing Nanci Bompey at [email protected]. Please provide your name, the name of your publication, and your phone number.
Neither this paper nor this press release is under embargo.
“Continent-wide, interferometric SAR phase, mapping of Antarctic ice velocity”
Authors
J. Mouginot: Department of Earth System Science, University of California, Irvine, CA, USA; and Univ. Grenoble Alpes, CNRS, IRD, Grenoble, France;
E. Rignot: Department of Earth System Science, University of California, Irvine, CA, USA; California Institute of Technology’s Jet Propulsion Laboratory, Pasadena, CA, USA; and Department of Civil and Environmental Engineering, University of California, Irvine, CA, USA.
B. Scheuchl: Department of Earth System Science, University of California, Irvine, CA, USA.
Contact information for the researchers:
Jeremie Mouginot, UCI
[email protected]
Nanci Bompey
+1 (202) 777-7524
[email protected]
UCI Press Contact:
Brian Bell
+1 (949) 824-8249
[email protected]